3.4 billion GPS points, five years, one browser tab — and no tile server in sight
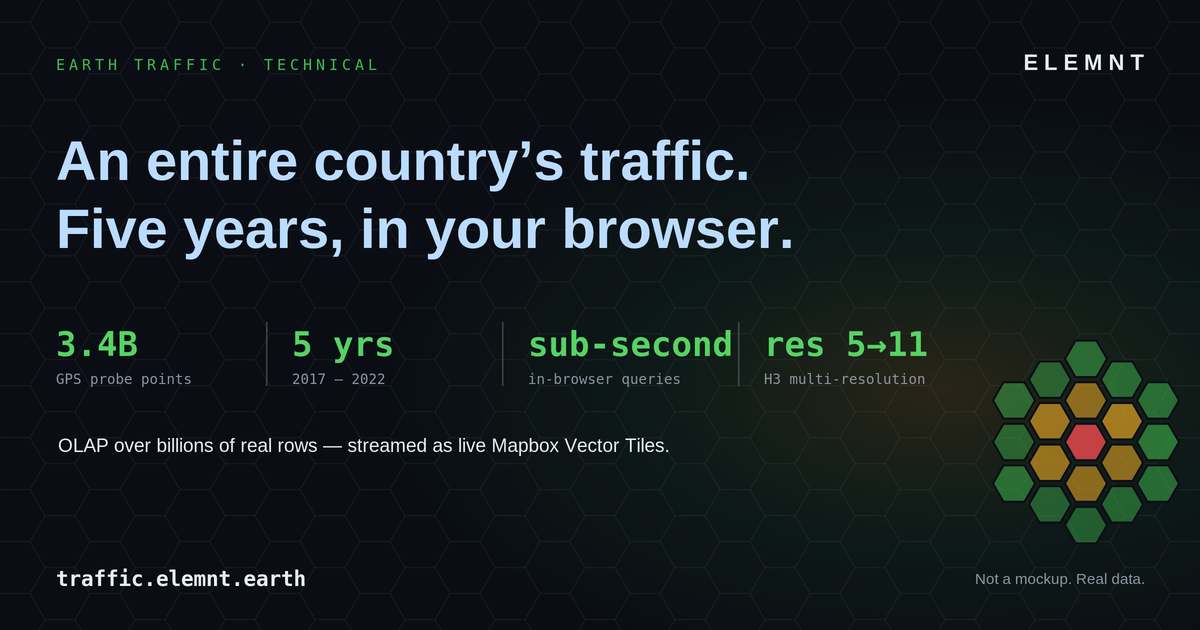
How ELEMNT serves an entire country's traffic history at sub-second speed, and what that means if you still run a room full of GIS servers.
ELEMNT Engineering · ~10 min read
A single hover on the traffic.elemnt.earth console returns this: res 10 · TTI 1.84 · LOS E · 1,204 probes, with the tile query clocked at q 0.48s. That one tooltip is sitting on top of 3.4 billion GPS probe points — an entire country, five years of it (2017–2022) — and it answered in under half a second, in a browser, with nothing rendering server-side.
If you manage an enterprise GIS estate, that sentence should read as a quiet provocation. You know what it normally takes to put five years of national movement data in front of a user: a tile cache that takes a weekend to rebuild, a GeoServer cluster someone has to babysit, and a "please don't pan too fast" disclaimer. This is a walk through how the demo is built — the medallion pipeline, the H3 index, the columnar engine, the vector tiles, the client — and then a straight answer to the only question that matters to your CIO: so what, and what does it cost me?
The pain you already know
Legacy spatial stacks fail in predictable, expensive ways. A basemap update means re-publishing thousands of cached tiles. Adding a new metric to an existing map means a new layer, a new cache, a new service endpoint. Standing up a viewer for a regulator means another GeoServer or ArcGIS Server instance to patch and monitor. And when the auditor asks "who changed this layer and when," the honest answer is often a shrug.
Underneath all of it is one architectural assumption from the 2000s: the server renders the map. Every pan, every zoom, every style change is a round trip to a machine that draws pixels and ships them back. That assumption is what makes traffic data — high-volume, multi-metric, time-varying — so painful to serve at national scale. Earth Traffic is built on the opposite assumption, and the whole pipeline follows from it.
What the demo actually is
Earth Traffic is an operations console, not a brochure. It replays a country's road network hour by hour across five years. You scrub a timeline from 2017 to 2022, watch the H3 hexagon grid wash from green to red as congestion builds through each rush hour, and switch between four mobility metrics — TTI (Travel Time Index), PTI (Planning Time Index), Speed, and LOS (Level of Service, the A–F congestion grade) — without the map ever reloading. Zoom from the national view down to a single intersection and the grid re-quantizes itself; the data is the same, the resolution changes underneath you.
It runs on the same primitives as the ELEMNT platform: open vector tiles, object storage, a CDN edge, and OGC API endpoints. No special-case infrastructure. That is the point of shipping it as a demo — it proves the platform does the hard thing on a genuinely large, real dataset. As the technical card says: not a mockup, real data.
The architecture, end to end
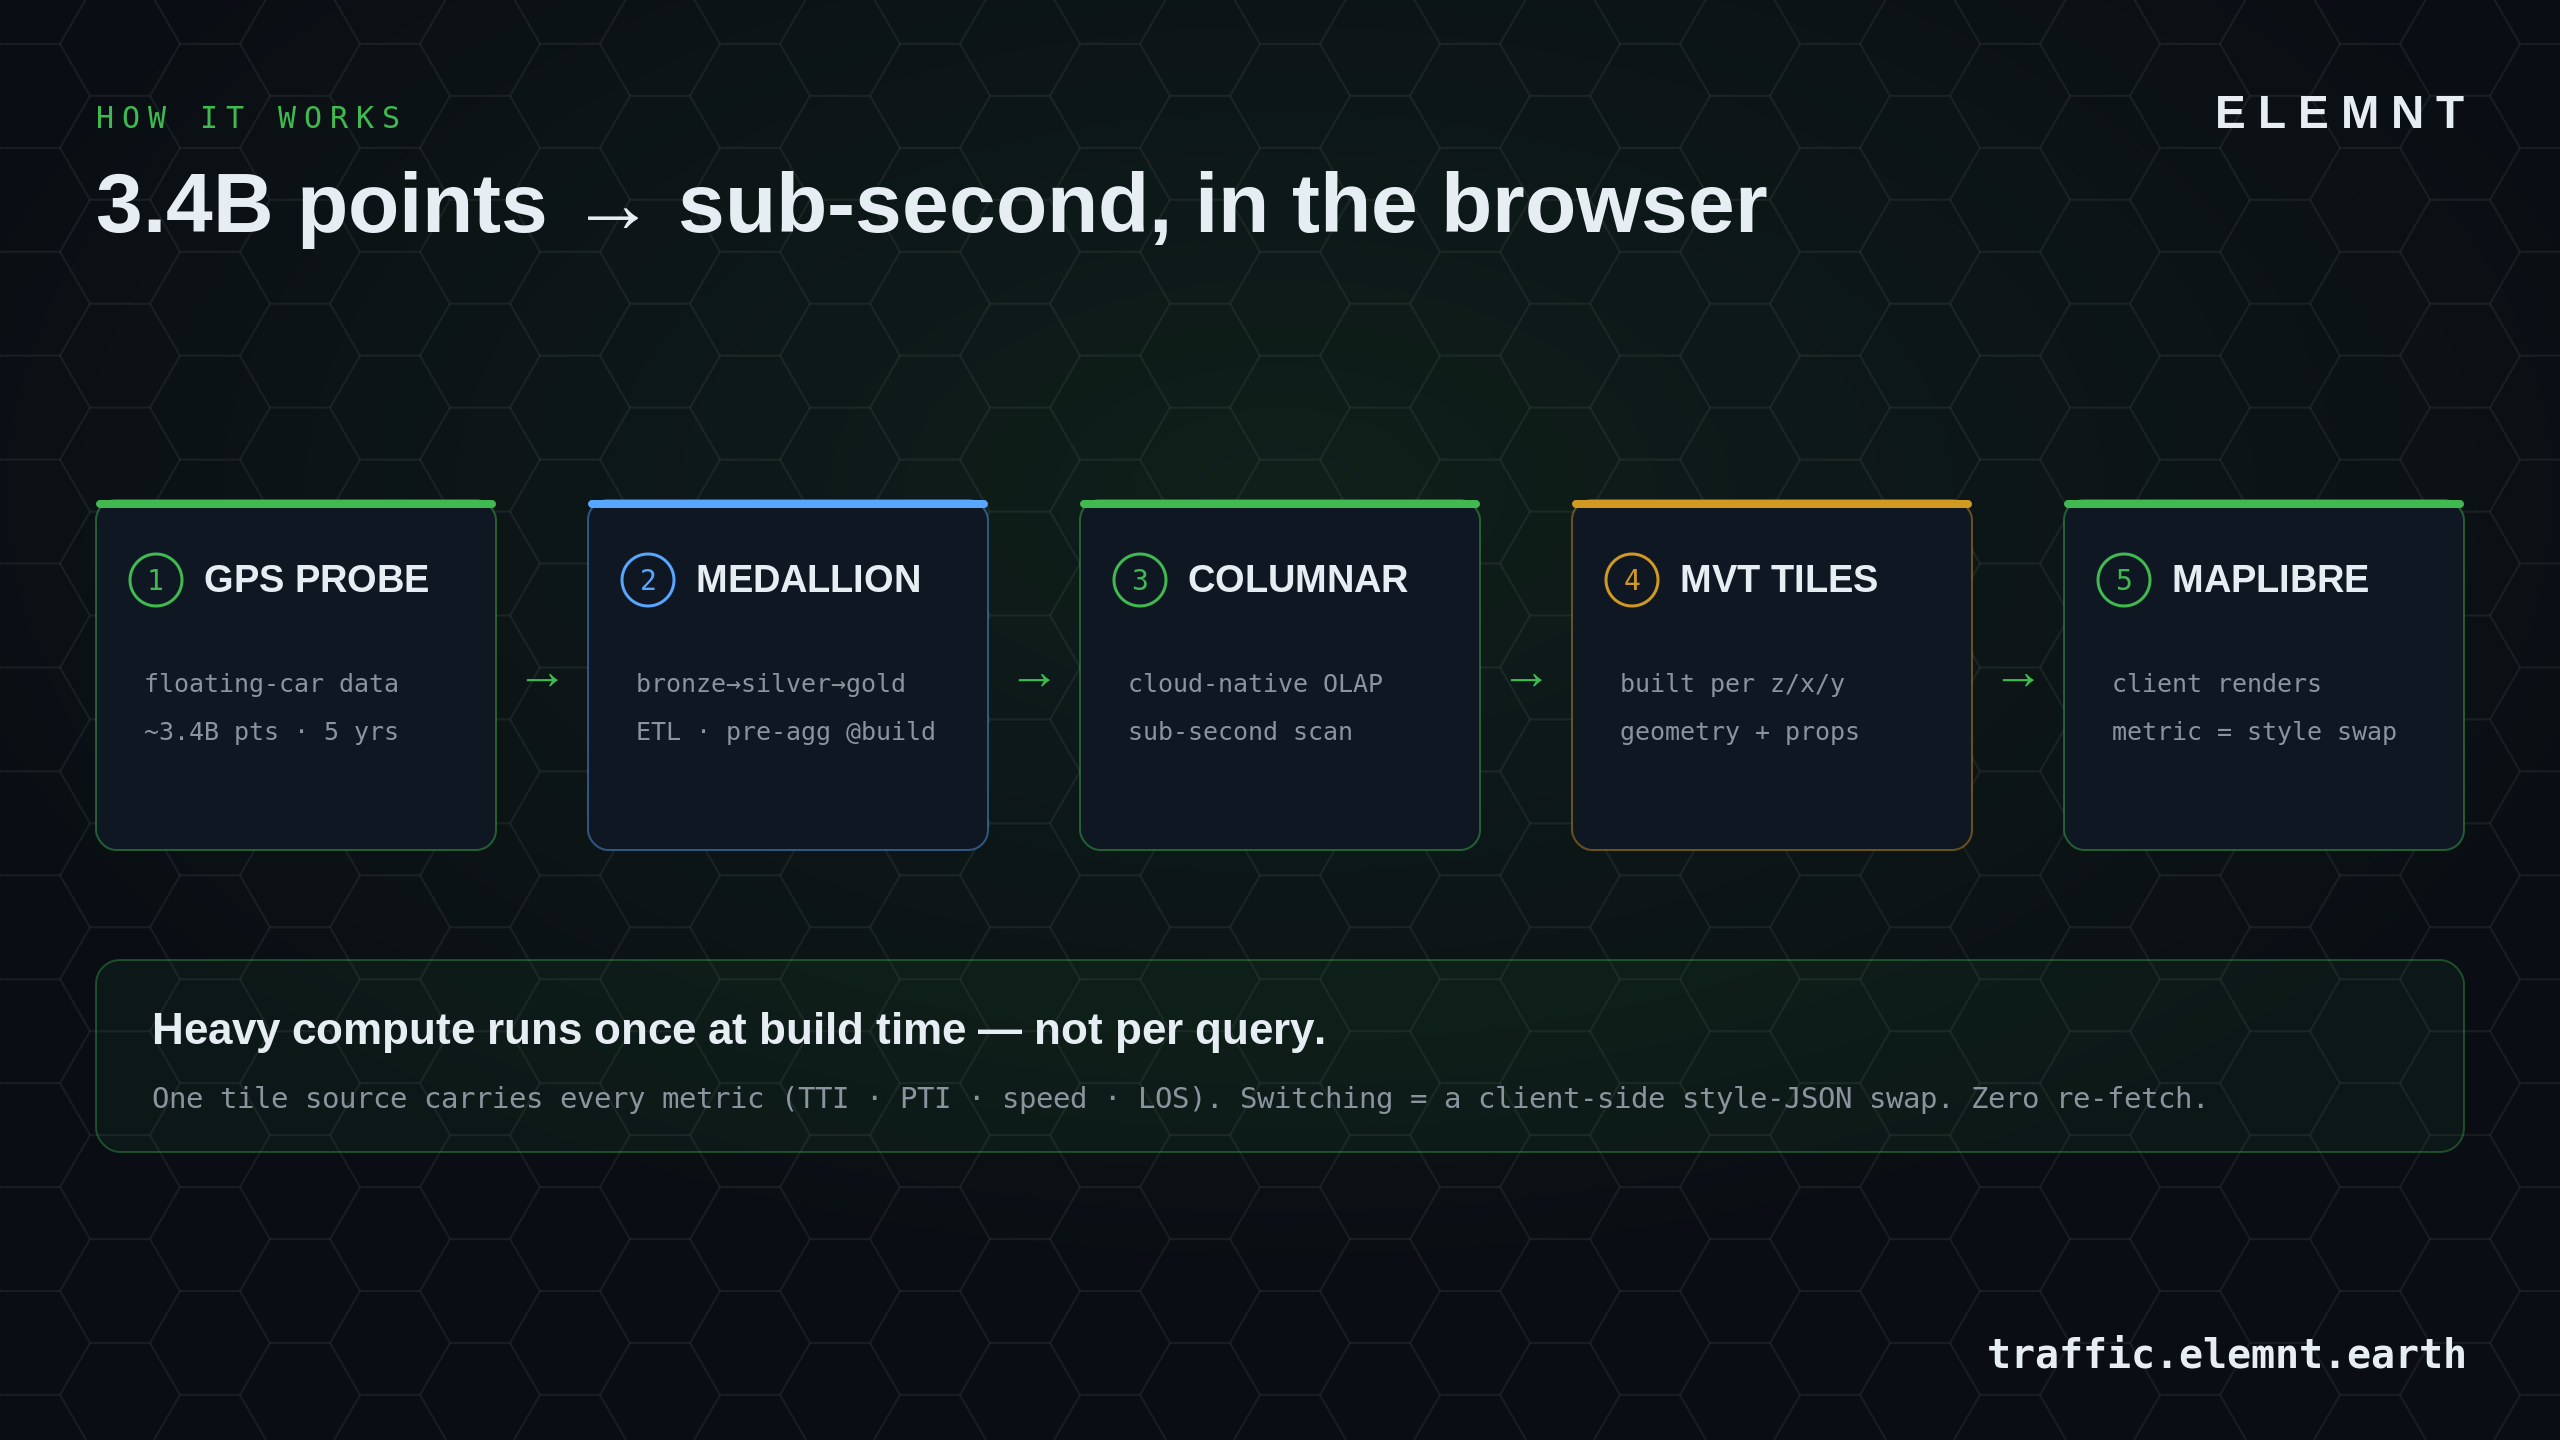
Here is the whole pipeline. Heavy computation happens once, on the left, at build time. Everything to the right of the columnar store is cheap and happens per request.
1. Raw probes → bronze
The input is floating-car data: anonymized GPS probe points emitted by vehicles moving through the network. Roughly 3.4 billion of them across five years. Raw probes are noisy — gaps, drift, duplicate pings, off-network coordinates. They land in the bronze layer exactly as received, immutable, so the pipeline is always reproducible from source.
2. Bronze → silver → gold (the medallion)
This is a standard medallion architecture, and it is where the expensive work is deliberately concentrated. Silver is cleaned and conflated: map-matched to the network, de-duplicated, outliers dropped, timestamps normalized to UTC ISO-8601. Gold is the payoff — probes are aggregated into H3 hexagons, per hour, with each mobility metric pre-computed: TTI, PTI, mean speed, LOS, and the probe count behind each cell.
The discipline here is the whole trick: the heavy compute runs once at build time, not per query. When a user later asks for "Bangkok, 14:00 on a Wednesday in March 2020," the system is not scanning 3.4 billion raw rows. It is reading a small set of pre-aggregated gold rows that were computed months ago. That is why a national, five-year query returns in 0.48s instead of timing out.
3. The H3 multi-resolution index
Every gold row is keyed to an H3 cell. H3 is Uber's open hexagonal hierarchical spatial index, and the two words that matter are hexagonal and hierarchical.
Hexagons beat squares for movement data because every neighbor is equidistant — there are no awkward diagonal adjacencies, so flow and congestion gradients render honestly. Hierarchical means the grid exists at sixteen nested resolutions at once. Earth Traffic uses resolutions 5 through 11, and that single design choice is what makes the country-to-street zoom seamless:
| H3 res | Avg hexagon area | Avg edge length | What it resolves |
|---|---|---|---|
| 5 | 252.9 km² | 9.85 km | region |
| 6 | 36.1 km² | 3.72 km | metro area |
| 7 | 5.16 km² | 1.41 km | district |
| 8 | 0.737 km² | 531 m | neighborhood |
| 9 | 0.105 km² | 201 m | city block |
| 10 | 15,048 m² | 75.9 m | street segment |
| 11 | 2,150 m² | 28.7 m | intersection |
Average cell statistics, computed on a spherical (WGS84 / EPSG:4326) model — source: the official H3 resolution table.
At the national view you serve res 5 or 6: a few thousand fat hexagons, tiny payload. Zoom in and the server hands you res 10 or 11 for just the visible extent. There is no separate "overview" dataset to maintain and no reprojection step — it is one coordinate system, one index, re-quantized on the way out. For scale intuition: a country the size of Thailand is roughly 34 million res-10 hexagons; you never ship more than a screen's worth at a time.
4. The columnar OLAP engine
Gold lives in a cloud-native columnar store. Columnar matters for exactly one reason: an analytical query touches a handful of columns (say tti and probes) across many rows, and a column store reads only those columns off disk instead of every field of every row. Combine that with the gold pre-aggregation and a national, multi-year scan stays sub-second. This is the same columnar discipline ELEMNT uses across the platform — the demo just points it at traffic.
5. Tiles built per z/x/y
When MapLibre requests tile z/x/y, the serving layer asks the columnar store for the gold hexagons that intersect that tile at the resolution appropriate to the zoom, encodes them as a Mapbox Vector Tile (MVT) — geometry plus properties — and returns it. MVT is an open specification; the tile is just protobuf-packed geometry with attributes attached. Crucially, every tile carries every metric. Each hexagon feature ships with tti, pti, speed, los, and probes already on it.
6. The client, and the trick that makes it feel instant
MapLibre GL JS renders those tiles with WebGL in the browser. Because each hexagon already carries all four metrics, switching metrics is a client-side style change, not a data fetch. You are not loading a "speed layer" — you are telling the GPU to color the same hexagons by a different property.
// One vector source. Every hexagon already carries
// tti, pti, speed, los, and probes as feature properties.
map.addSource('traffic', {
  type: 'vector',
  tiles: ['https://traffic.elemnt.earth/tiles/{z}/{x}/{y}.mvt'],
  minzoom: 4, maxzoom: 11
});

// Switching the visible metric = swap one paint expression.
// Zero tiles are re-fetched.
function showMetric(metric) {            // 'tti' | 'pti' | 'speed' | 'los'
  map.setPaintProperty('hexes', 'fill-color', RAMPS[metric]);
}

const RAMPS = {
  tti:   ['interpolate', ['linear'], ['get', 'tti'],   1.0, '#2e7d32', 1.5, '#f9a825', 2.5, '#c62828'],
  speed: ['interpolate', ['linear'], ['get', 'speed'],   0, '#c62828',  60, '#f9a825', 110, '#2e7d32'],
  // pti, los …
};
That is why metric switching lands in about 16 milliseconds — one frame at 60fps. The tooltip on hover is the same idea: the data is already in the browser, so the read is a lookup, not a round trip. The time scrubber works the same way, stepping through hourly tiles with a density sparkline showing which hours actually have probe coverage, all driven from the keyboard (space to play, ←/→ to step an hour).
The headline for an architect: one tile source carries the entire map. Four metrics, every hour, five years, country to intersection — and the only server-side work per interaction is handing back a small pre-computed tile from object storage through a CDN.
The part your auditor will care about: it's open by default
Earth Traffic exposes its data through OGC API – Features, not a proprietary endpoint. Anyone can pull the underlying hexagons as GeoJSON, CSV, or newline-delimited JSON — no auth, coordinates in EPSG:4326, timestamps in UTC ISO-8601, speeds in km/h.
# Every res-9 hexagon for one hour over Bangkok, as GeoJSON — open, no key.
curl "https://traffic.elemnt.earth/ogc/collections/traffic/items?\
datetime=2020-03-18T14:00:00Z&resolution=9&\
bbox=100.46,13.68,100.65,13.83&f=geojson"

# Same query, streamed as NDJSON straight into a local analysis.
curl "https://traffic.elemnt.earth/ogc/collections/traffic/items?...&f=ndjson" \
  | duckdb -c "COPY (SELECT * FROM read_json_auto('/dev/stdin')) TO 'bkk.parquet'"
This is the difference between a map you can look at and data you can build on. The visualization and the export are the same OGC-standard source. If a regulator mandates open data publishing, you are already compliant — it isn't a separate project.
What this changes for an enterprise GIS estate
Translate the architecture into your world:
No tile server to run. Vector tiles served from object storage through a CDN means there is no GeoServer or ArcGIS Server instance in the hot path to patch, scale, or wake up for at 2 a.m. The serving layer adds auth and metering, not rendering.
Add a metric without adding infrastructure. Because one tile source carries all metrics and the client styles them, a new dimension is a build-time change to the gold layer — not a new service, a new cache, and a new endpoint.
OGC where Esri is partial. ArcGIS support for the modern OGC API family is still partial and bolted on; ELEMNT speaks OGC API – Features and Tiles natively, with a STAC catalog for discovery. When your procurement spec says "OGC compliant," that's the difference between native and an asterisk.
Pay-per-use, not per-seat. ELEMNT's delivery cost is about $0.0000141 per tile at 50 million tiles a month, which is why the published rate lands roughly 25× under Mapbox at mid-market volumes, with a 100K free tier across every SKU. You pay for tiles served, not named users who may or may not log in.
The migration math is the argument that actually moves a CIO. From ELEMNT's Strategic Report comparison (Case B — 40 named users, 2 TB raster, 1,200 layers, OGC required):
| ArcGIS Online | ELEMNT | |
|---|---|---|
| Annual cost | $116K | $22K |
| Pricing model | named-user licenses | pay-per-use |
| Tile server to operate | yes | none (object storage + CDN) |
| OGC API | partial, bolted-on | native |
| Self-host option | ArcGIS Enterprise | same containers, your Kubernetes |
That is an 81% reduction on the use cases that don't need ArcGIS Pro on the desktop — and it unblocks the OGC publishing project at the same time.
You do not rip anything out to get there. The proven play is to put ELEMNT in as the read, publish, and share layer first — the public viewer, the regulator export, the field-facing map — while ArcGIS Pro keeps doing authoritative editing. Existing geodatabases come across through the native PostGIS driver and shapefile/GeoPackage import; your schemas are honored. Then you phase the rest at renewal time, on your terms, not the vendor's.
What we don't claim
Honesty is part of the pitch, so here is the boundary.
The "sub-second, in your browser" line is precise, not loose: the browser is not running OLAP over 3.4 billion rows on your laptop. The heavy aggregation happened once at build time; what's fast at runtime is the tile fetch (~0.48s), the metric swap (~16ms), and the hover read. That distinction is the whole engineering story — we're not going to blur it to sound more magical.
Earth Traffic is a use-case showcase built on one large national dataset; it is not a turn-by-turn navigation SDK and it is not Street View — pair ELEMNT with a routing engine or Google for those. ELEMNT is also not a wholesale Esri replacement on every dimension; Esri has twenty years of feature breadth and CIO relationships that you win deal by deal, not in a blog post. And two flagship platform capabilities are still ahead of us on the roadmap: Git-style data versioning is GA in Q4 2026 and real-time collaborative editing in Q1 2027. We'd rather tell you that now than in a procurement meeting. The platform itself reaches public GA on July 15, 2026.
See it move
Reading about a heatmap that "breathes" is a poor substitute for scrubbing one. Open traffic.elemnt.earth, hit space to play, drag the timeline across 2017–2022, and switch between TTI, PTI, Speed, and LOS while you watch a whole country's rush hours rise and fall. Then zoom to a single intersection and notice that nothing reloads.
What is ELEMNT?
ELEMNT is the cloud-native geospatial data platform — open formats (PMTiles, COG, Zarr, GeoParquet) served straight from object storage, OGC API-compliant, with transparent pay-per-use pricing and no vendor lock-in. From a single project to a billion tiles. Earth Traffic is one demo of what it can do.